You don't need another chart. You need one number finance, operations, and clinical leaders will all defend in the same meeting.
That's the test for dashboards in healthcare. If a metric can't survive a question about its definition, denominator, allocation method, or owner, it isn't ready for a dashboard. It's ready for governance work first.
Table of Contents
- The Monday Morning Every Healthcare Finance Leader Recognizes
- What a Clinical and Financial Dashboard Actually Is
- High-Value Use Cases for Healthcare Dashboards
- Must-Have KPIs and the Traps Behind Each One
- HIPAA and Audit Controls Inside the Dashboard
- Software Alone Versus the Right Implementation Partner
- Integration Strategy and Go-Live Checklist
- Summary
The Monday Morning Every Healthcare Finance Leader Recognizes
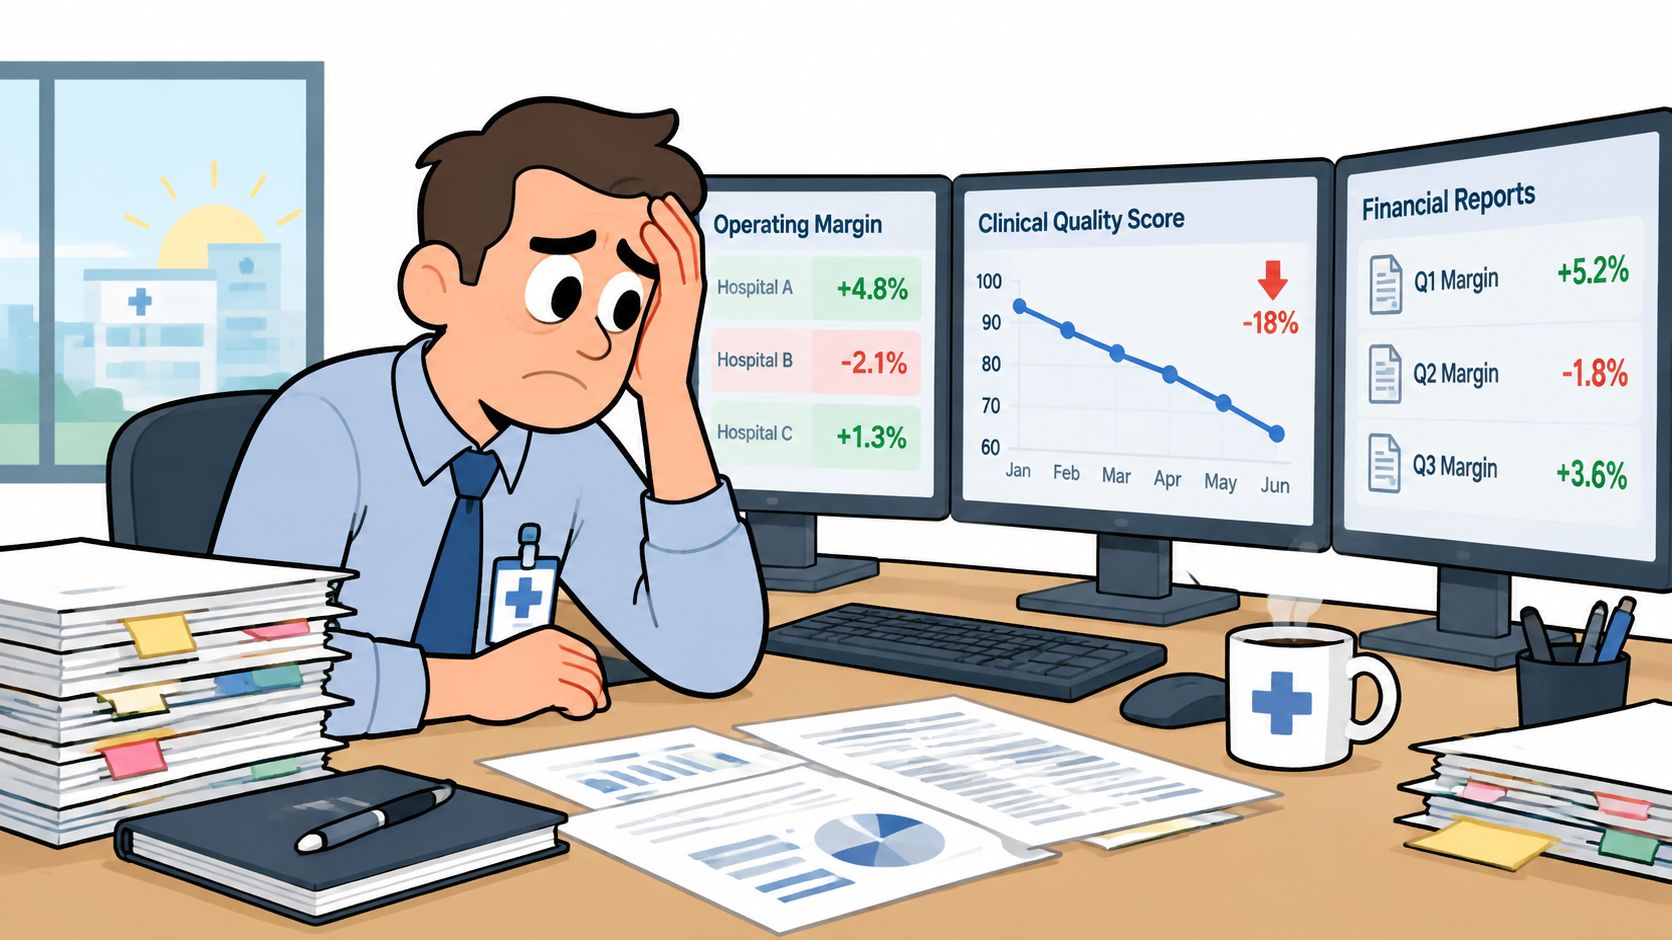
It's 7:40 a.m. on Monday. You're a CFO at a multi-site provider group, leadership meets in an hour, and you've got three different margin numbers on your desk.
One came from the month-end spreadsheet package. One came from a service-line report someone rebuilt last month. The third excludes shared-service allocations, although nobody labeled it that way. Your COO walks in with a quality score that looks strong, while finance shows the same location losing money, and neither of you can tell whether you're looking at a performance problem, a coding difference, or a timing problem.
Fragmented Systems Produce Conflicting Stories
This isn't a visualization problem. Your EMR closed encounters on one calendar, payroll posted labor on another, and the general ledger carries allocations that don't match the operating report your clinic managers use. Each system is doing its own job. Together, they produce conflicting pictures of the same organization.
I've seen this pattern stall board reporting, lender conversations, and site-level decisions. Leaders spend the meeting debating which number is right instead of deciding whether to add staff, renegotiate a payer contract, or intervene at an underperforming location. The underlying challenge often sits in broader health data interoperability, where timing, standards, and data exchange practices affect whether systems tell the same story.
Until finance and clinical data share definitions and timing, every dashboard is just another opinion with better formatting.
What Has to Change First
A single source of truth doesn't mean one giant report. It means agreed dimensions for entity, location, department, and service line, consistent refresh timing, and a clear rule for how corporate, physician, and shared-service costs land on each site. When those rules are settled, a margin swing becomes explainable. You can trace it to volume, payer mix, labor, or an allocation change, and you can show your work to a board member or an auditor.
If you're still reconciling spreadsheets before every leadership meeting, don't start by shopping for dashboard software. Start by deciding who owns each definition and which system is authoritative for each data domain. That work is slower than buying a tool, and it's the only work that makes the tool worth buying. Many teams use a formal data governance framework to assign ownership and standardize definitions before any dashboard rollout.
What a Clinical and Financial Dashboard Actually Is
A clinical and financial dashboard is a role-based view that pulls governed data from your EMR, ERP or general ledger, payroll, and revenue cycle systems, then applies the same definitions every time it refreshes. A CFO sees consolidated and entity-level results. A clinic manager sees location-level results. A service-line leader sees contribution after direct costs and, separately, after allocations.
Think of a cockpit instrument panel. Each gauge matters, but a bad reading on one gauge can mislead the whole crew. A dashboard works the same way. If labor hours don't reconcile to payroll or encounter volume doesn't reconcile to revenue, the panel looks complete while sending leaders in the wrong direction.
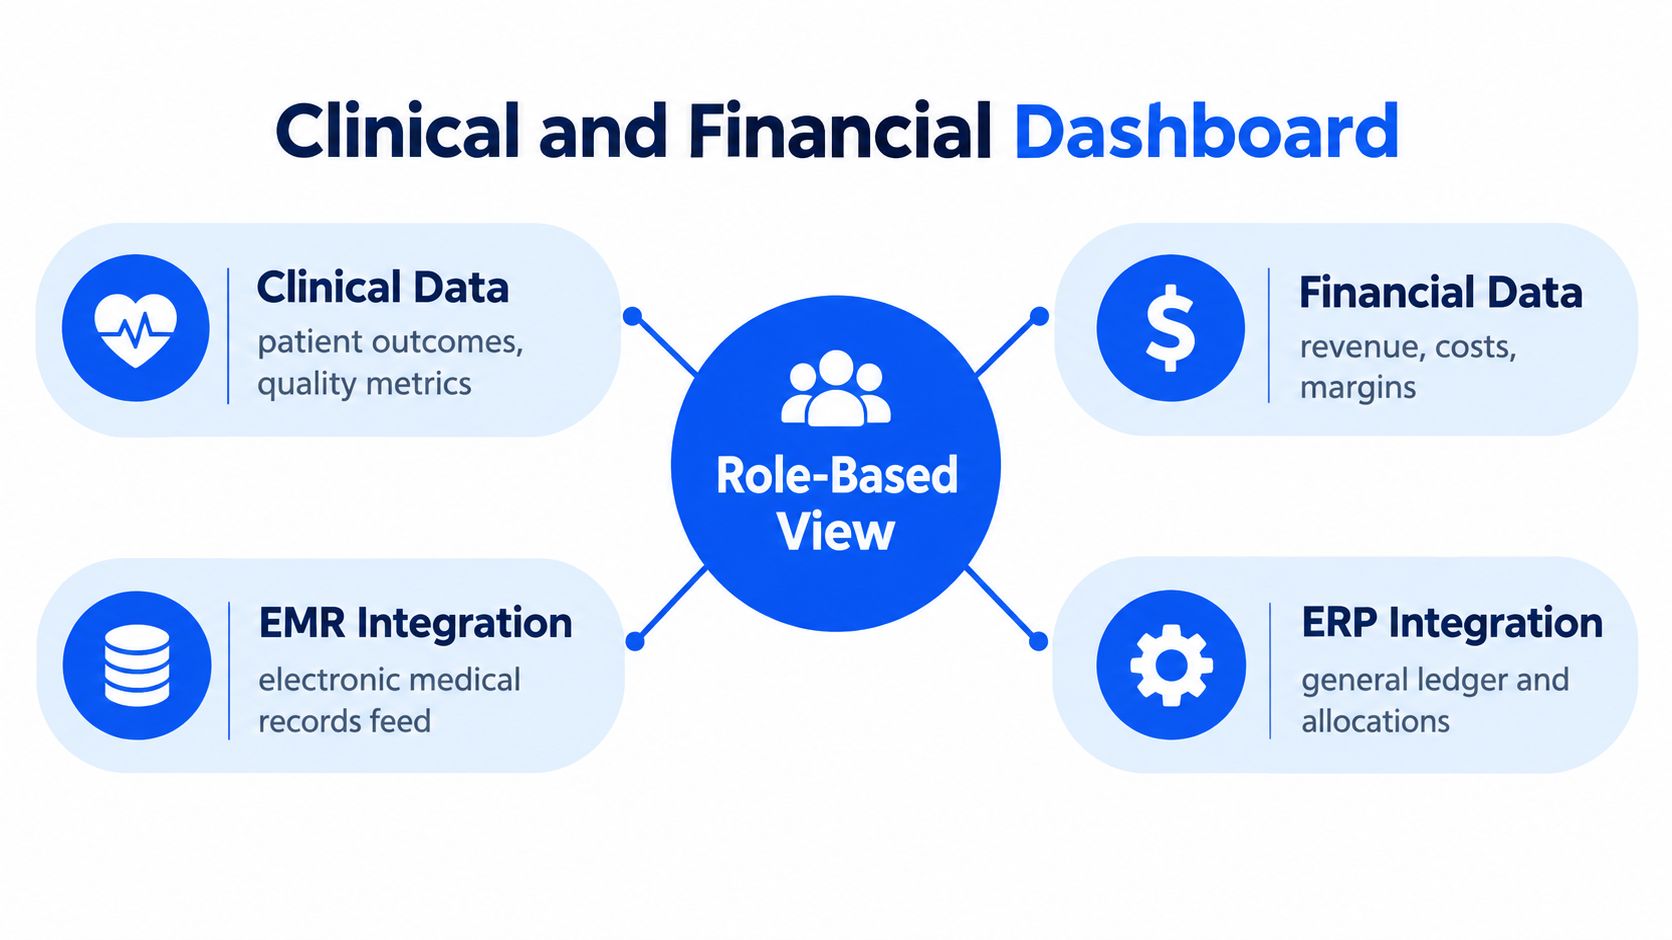
Three Architectures Leaders Confuse
- Thin visualization over raw extracts: Charts sit on spreadsheet exports. It's fast to build and fragile to maintain, because definitions live in the extract logic.
- Data warehouse with curated definitions: Data is centralized and standardized before reporting. This is stronger, provided someone owns mapping, validation, and change control.
- ERP-native dashboard: Financial dimensions, entities, and allocations are already governed in the ledger, so finance views trace back to approved reporting structures.
None of these is automatically right. The warehouse model can serve clinical and financial data well if governance is disciplined. The thin layer fails most often at multi-site groups, because each site develops its own denominator. Organizations evaluating architecture options often compare them against common enterprise data warehouse patterns and BI governance requirements.
Evidence supports the mixed nature of this work. A 2024 scoping review of 118 healthcare dashboards found 38.1% were in inpatient settings and 35.6% in outpatient settings, while 71.2% had at least two stated purposes. Administrative functions appeared in 45.8%, clinical functions in 36.4%, and both in 16.9%, based on that same review. For a practical revenue-focused complement to this architecture discussion, the dashboard guide for provider revenue is useful reading on how provider organizations frame revenue visibility.
That mix is why combined dashboards are harder than either side alone. You're not just displaying data. You're aligning clinical activity, financial results, timing, and access rules in one operating view.
High-Value Use Cases for Healthcare Dashboards
Buy use cases, not chart libraries. Each use case below answers a specific question and enables a decision you can name in advance.
Close, Margin, and Service-Line Decisions
Monthly close acceleration asks where the close is blocked and which entities haven't posted, reconciled, or reviewed results. The decision is where the Controller intervenes today, not after the board package is late. For multi-entity groups, our guidance on consolidating and automating finances across multiple entities addresses the underlying consolidation work that makes this view credible.
Service-line contribution analysis asks whether a specialty covers its direct costs and its fair share of shared costs. The decision is whether to invest, reprice, restructure, or exit. This only works if allocation methods are visible, a point covered in detail in the KPI discussion later in this article. Many health systems frame this work through service line management to link operational demand with financial performance.
Payer mix and denial visibility asks which payers, locations, or service types are driving denied or underpaid claims. The decision is where revenue-cycle leaders focus follow-up and whether a contract deserves renegotiation. A denial rate without payer and location dimensions can't answer either question. Benchmarking against common revenue cycle management practices can help teams decide which denial categories and payer views belong in phase one.
Labor, Care Gaps, and Payment Model Exposure
Labor productivity by department asks whether staffing matches volume and acuity. The decision is scheduling, overtime approval, or use of premium labor. Show labor cost with hours and volume, not cost alone, or managers will cut hours in ways that damage access. Measures tied to workforce productivity in healthcare are most useful when paired with volume and patient demand.
Care-gap closure tied to revenue asks which overdue screenings or follow-ups remain open, who owns outreach, and whether closure affects quality-based payment. A 2025 systematic review of primary-care dashboards found four studies using dashboards within multifaceted interventions improved at least one primary outcome, while two studies of standalone dashboards produced mixed results. Display alone isn't an intervention. The dashboard has to connect a flagged patient to outreach and record whether the gap closed. This is especially relevant in value-based care, where quality performance and reimbursement are closely linked.
Capitation versus fee-for-service exposure asks how much revenue depends on utilization you control versus volume you generate. The decision is risk management, panel management, and contract strategy. Teams often monitor this through basic alternative payment model segmentation so leaders can see where financial exposure is shifting.
Selection rule: If nobody can name the decision a use case changes, cut it from phase one, no matter how attractive the chart looks.
Patient satisfaction scores shown without staffing, access, or case-mix context often underperform for the same reason. They describe sentiment without pointing to an operational lever. Keep them, but pair them with the drivers leaders can actually change. Standard patient experience frameworks can help determine which supporting operational metrics belong next to satisfaction data.
Must-Have KPIs and the Traps Behind Each One
Start with a short KPI list, grouped by financial, operational, and clinical categories. Then require every KPI to travel with its definition, denominator, owner, and refresh date. Our overview of key financial metrics for healthcare businesses covers the finance side of this inventory in more depth. If teams need a broader baseline, standard key performance indicator design principles are a useful cross-industry reference.
| KPI Category | Example Metric | Required Context |
|---|---|---|
| Financial | Operating margin by entity | Revenue type, allocations, nonrecurring funding |
| Financial | Days in accounts receivable and denial rate | Payer mix, location, claim age |
| Operational | Labor hours per adjusted patient day | Volume, acuity, premium labor |
| Operational | Supply cost per case and no-show rate | Case mix, specialty, schedule type |
| Clinical | 30-day readmission rate | Risk adjustment, diagnosis, denominator |
| Clinical | Care-gap closure rate and healthcare-associated infections | Eligible population, exclusions, follow-up status |
Margin Is the KPI Most Often Misread
Hospital margins are too narrow for casual definitions. A summary of Kaufman Hall hospital margin reporting reported a 3.8% year-to-date median operating margin in May, compared with 0.3% one year earlier, while approximately 40% of hospitals were still losing money. Kaufman Hall defines its operating-margin index after allocations from corporate, physician, and other entities are applied, based on that same report.
Later reporting made the allocation effect impossible to ignore. Coverage of Kaufman Hall margins including and excluding health-system allocations showed a 3.3% year-to-date margin including allocations versus 6.9% excluding them for the first four months of 2025. Show margin before allocations, the allocation amount, and margin after allocations. One unexplained enterprise number hides whether a service line is weak or carrying more centralized cost. Margin interpretation also depends on standard cost allocation methods that leaders can explain and defend.
Normalized results matter too. Federal data summarized in an IPPS hospital operating margin filing put the 2022 aggregate all-payer operating margin for 3,160 IPPS hospitals at 2.7%, falling to 1.9% when federal COVID-19 relief funds were excluded. Separate patient-service revenue, relief or government funding, operating expense, and cash indicators, or you'll overstate sustainable performance.
Clarity Does Not Guarantee Correct Interpretation
A statewide surgical-quality dashboard study summarized in research on dashboard interpretation and disparity measures found 70% of respondents agreed information was clear and understandable, yet 46% to 49% interpreted results incorrectly. That's the trap. Pair quality and equity metrics with exposure definitions, denominators, confidence intervals where relevant, interpretation guidance, and an action threshold. Small samples, coding differences, and unequal case mix can all look like performance changes. Practical guidance on data visualization best practices supports this point, especially when users need to make quick operational judgments.
A dashboard can be polished and widely adopted while still producing poor decisions.
For outcomes, stay disciplined about claims. A 2025 systematic review of hospital dashboard outcomes found, across 43 length-of-stay findings from 31 studies, 28 reported a reduction, five an increase, and 10 no change. Among 20 mortality findings from 16 studies in that review, five reported a decrease and 15 found no statistically significant change. Dashboards can support shorter stays and better experiences, but don't promise mortality improvement from visualization alone.
HIPAA and Audit Controls Inside the Dashboard
Treat HIPAA as an architecture requirement, not a procurement checkbox. Once a dashboard combines financial, operational, and patient-related information, access design becomes part of the control environment.
What the Security Rule Requires in Practice
The HIPAA Security Rule technical safeguards guidance requires unique user identification and an emergency access procedure, while automatic logoff is an addressable specification. Its Audit Controls standard requires mechanisms that record and examine activity in information systems containing or using electronic protected health information, according to that same guidance.
Translate that into dashboard questions you ask before go-live:
- Unique identity: Can every view, export, and change be tied to an identifiable user, with no shared logins?
- Role-based access: Can a CFO see consolidated results while a clinic manager sees only the assigned location and entity?
- Emergency access: Who can break normal restrictions, under what approval, and how is that access reviewed afterward?
- Audit review: Who examines logs, how often, and what happens when access doesn't match job responsibility?
Our discussion of Sage Intacct and HIPAA compliance considerations is relevant here because the reporting environment, not just the EMR, has to enforce these controls. Teams also commonly align dashboard access with broader role-based access control principles when designing permissions.
Aggregation Is a Control, Not a Limitation
Show aggregated metrics when patient-level detail isn't required for the decision. A board margin view rarely needs patient-level records. A care-gap worklist does, and that view belongs to a narrower clinical role with drill-through to the source encounter.
This distinction also reduces spreadsheet risk. Patient-level extracts circulating by email bypass role design, expiration, and audit review. A governed dashboard with restricted drill-through is easier to defend and easier to investigate if something goes wrong.
Software alone doesn't create compliant reporting. You still need configured roles, approval procedures, documented data mappings, and named owners for periodic access review. If a vendor can't walk you through those mechanics in a demo, you're buying a display layer and inheriting the control work yourself. In practice, many organizations borrow controls from broader healthcare cybersecurity guidance when evaluating reporting environments.
Software Alone Versus the Right Implementation Partner
This is the central buying decision for a mid-market healthcare organization, and it's where the cheapest path often becomes the most expensive one.
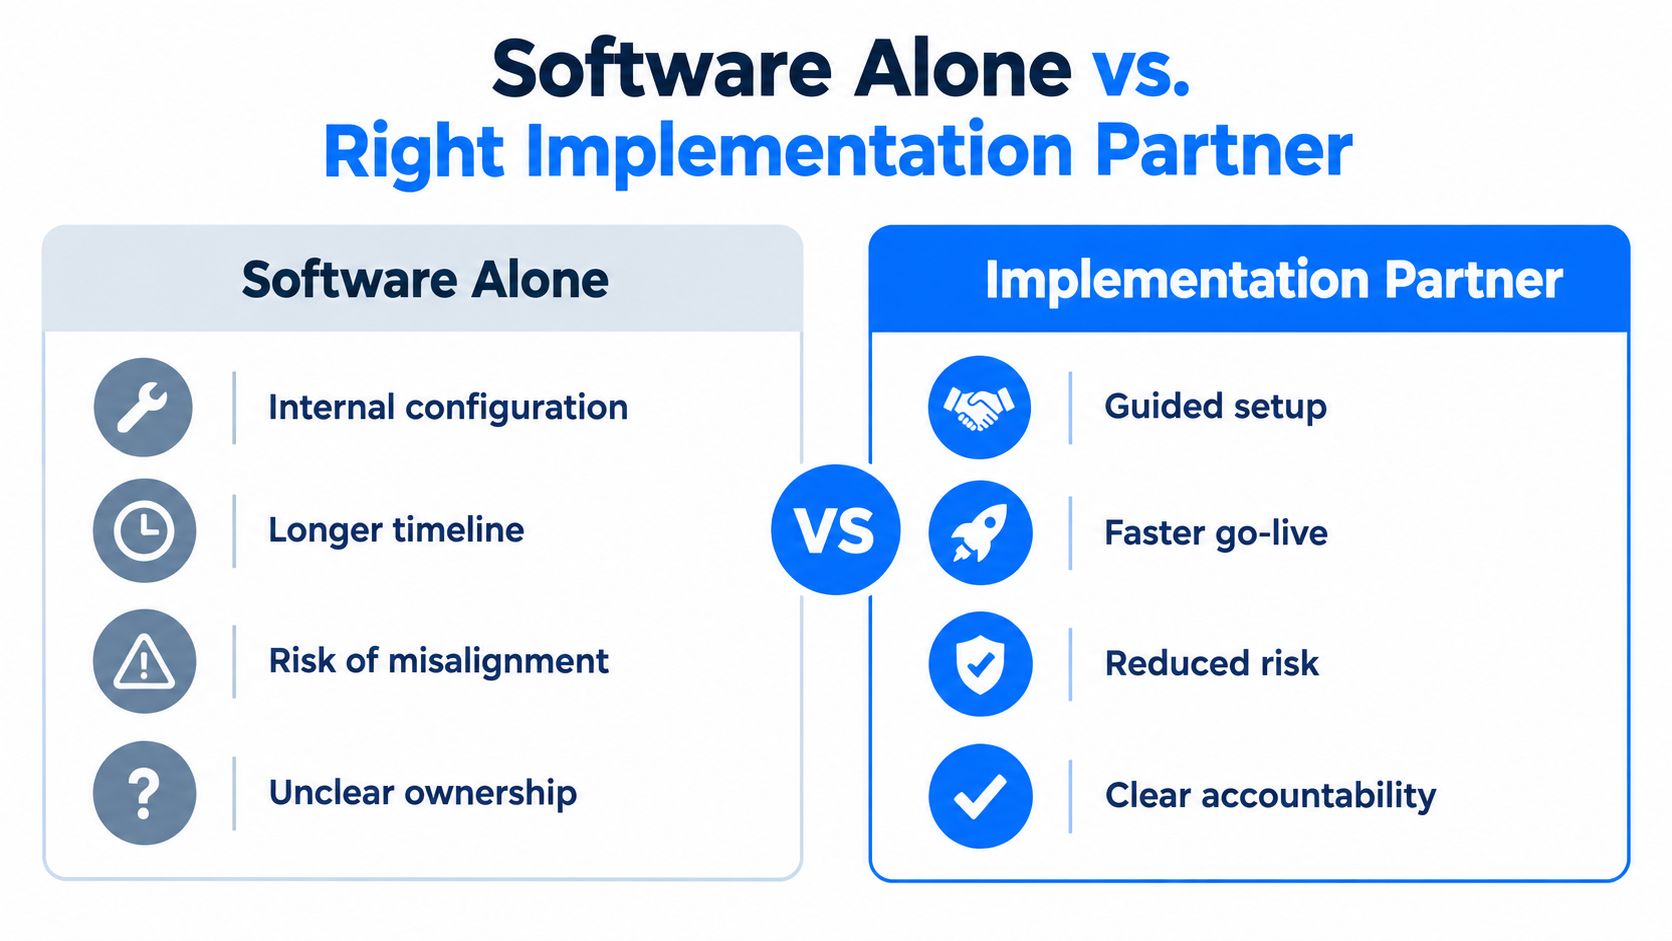
What Each Path Actually Delivers
Buying software and configuring it internally usually delivers faster procurement, lower upfront cost, and a polished first demo. It tends to break at the seams. Definitions drift across entities, allocation methodology lives in one analyst's spreadsheet, audit trails are thin, and the system depends heavily on whoever built it. When that person leaves, the next Controller inherits charts nobody can fully explain.
A partner-led implementation costs more upfront and takes longer to procure. Done well, it produces governed dimensions, validated integrations, documented allocations, role-based access, and reconciliation procedures the next CFO can run. You're not paying for chart building. You're paying for a reporting system that survives turnover, acquisitions, and audit scrutiny.
Evidence on implementation quality points the same way. A patient-reported-outcome dashboard pilot described in an EHR-integrated dashboard pilot study had 1,450 eligible patients, with 748, or 52%, completing at least one invitation, and 1,421 of 3,882 invitations, or 37%, resulting in completed questionnaires. Only 57% of surveyed patients in that study reported the dashboard was discussed during an eligible visit. Reach, workflow fit, and follow-up determined value, not screen design alone.
Implementation discipline is also inconsistent across the field. A 2026 scoping review of healthcare dashboard design found only 18 of 1,644 initially identified studies met its inclusion criteria, and 77.8% of included implementations described ad hoc rather than structured design guidelines. That review grouped successful practice into stakeholder engagement, meaningful content, usability and accessibility, and sustainable adoption. Similar lessons appear in broader change management frameworks, where adoption depends on ownership and process, not just tools.
For context on how ERP fits this decision, see our overview of ERP in healthcare organizations. In this market, Lucentive works as a Sage Intacct National Premier Partner implementing financial systems and dashboards for mid-market healthcare and nonprofit organizations. Evaluate any partner, including us, on documented dimensions, reconciliation method, allocation design, and post-go-live ownership, not on demo polish.
My recommendation: If you can't staff metric governance internally after go-live, don't buy software alone. You'll pay for the missing governance later, during an audit, an acquisition, or a leadership transition.
Integration Strategy and Go-Live Checklist
Integration is where dashboard promises meet operational reality. Standards can connect systems, but your team still has to trust, reconcile, and act on the numbers without adding manual work.
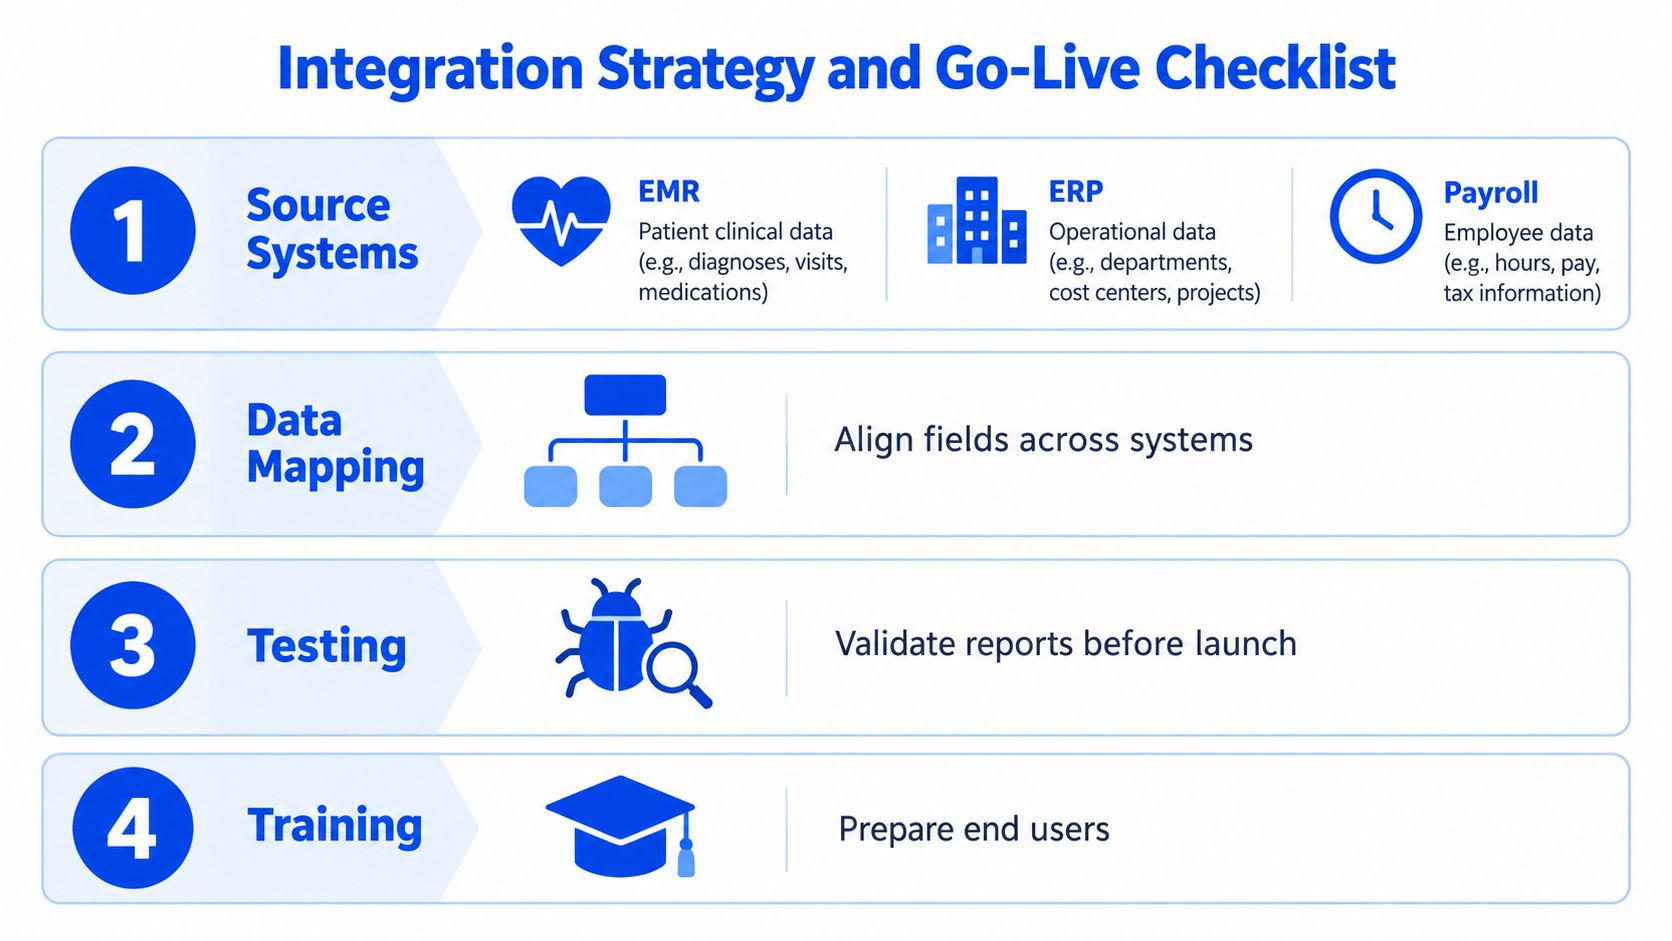
Source Systems and Ownership
Define what each system owns before you map a single field. Our guidance on integrating financial systems with an electronic medical record covers the finance and EMR seam that causes the most reconciliation work.
- EMR: Encounters, diagnoses, quality measures, and care-gap status. Clinical operations owns validation against source reports.
- ERP and general ledger: Entities, departments, accounts, allocations, and approved financial results. The Controller owns reconciliation to the ledger.
- Payroll: Hours, labor cost, premium pay, and department assignment. Finance and human resources jointly validate department mapping.
- Revenue cycle: Charges, payments, adjustments, denials, and payer dimensions. Revenue-cycle leadership owns payer and denial definitions.
Teams handling cross-system mapping often rely on established master data management practices to keep entities, departments, and payer dimensions aligned.
Build Sequence That Prevents Rework
First, define entities and dimensions, including location, department, service line, provider, and payer where relevant. Second, map source fields and document transformations, missing-data handling, and metric lineage. Third, reconcile one sample month to the general ledger and to a trusted clinical report before you build executive views. Fourth, configure role-based views, freshness indicators, timestamps, and audit logging.
Don't invert that order. Executive views built before reconciliation create pressure to defend numbers that haven't been proven. Teams that want repeatable reliability often document this work as data lineage so metric changes remain traceable over time.
Pre-Go-Live Acceptance Tests
Before launch, require a short checklist your CFO and Controller sign:
- Refresh cadence: Each data domain has a stated refresh frequency and a visible freshness timestamp.
- Reconciliation proof: Financial totals tie to the ledger, and clinical counts tie to an agreed source report for the test month.
- Access test: Users see only the entities, locations, and patient detail their roles permit.
- Action test: Each flagged KPI has an owner, a threshold, an escalation path, and a way to record follow-up.
- Change control: Definition changes require approval, documentation, and communication to dashboard users.
Assign ownership after go-live by name. Someone must monitor failed refreshes, stale data, access changes, and definition requests. Without that role, the dashboard becomes another silo, only newer and better formatted than the spreadsheets it replaced. A lightweight change control process can help teams keep definition updates from turning into reporting drift.
Summary
Dashboards in healthcare are a governance problem before they're a visualization problem. High-value use cases tie clinical activity to financial outcomes, decisions, and accountable owners. KPI design requires definitions, denominators, allocation visibility, and normalized results. HIPAA technical safeguards shape identity, access, emergency procedures, and audit review. Integration requires reconciliation across EMR, ERP, payroll, and revenue cycle systems. Software alone doesn't produce governed reporting, and the partner and implementation choices determine whether the system remains credible through turnover, audit scrutiny, and growth.
If your leadership team is still reconciling competing margin and quality numbers before every meeting, schedule a 30-minute working session with our team to pressure-test your definitions, allocations, and dashboard architecture. We'll show you how a Sage Intacct demo maps to your entities and reporting needs, with no pressure to buy before you can judge fit. Visit Lucentive to book that working session.