Month-end arrives, and the dental controller is pulling reports from 17 locations that don't agree. The CFO wants net collections by payor. Operations wants production-based provider compensation. The general ledger offers one broad dental income line, a payroll total, and several expense buckets too vague to explain why margin moved.
That isn't a close-process problem. It's a chart-of-accounts problem. A purpose-built dental practice chart of accounts separates what the practice produced, what it collected, what it adjusted, and what it spent to deliver care. It also gives a cloud ERP enough structure to produce location, provider, department, and payor reporting without turning the account list into an unmanageable collection of duplicate strings.
Table of Contents
- Why Dental Practices Need a Purpose-Built Chart of Accounts
- Account Numbering and Structural Rules That Scale
- Revenue Accounts for Production and Net Collections
- Payor Buckets for Insurance, Patient, and Membership Revenue
- Direct Expenses Tied to Clinical Production
- Operating Expenses Mapped to Overhead Benchmarks
- Payroll, Benefits, and Provider Compensation Accounts
- Cost Centers, Locations, and Funds for Multi-Site Practices
- Sample Account List at a Glance
- Implementing the Chart of Accounts in a Cloud ERP
- Summary
- Frequently Asked Questions
Why Dental Practices Need a Purpose-Built Chart of Accounts
A generic small-business chart can record deposits and bills, but it won't reliably explain dental economics. PPO contractual adjustments need to remain distinct from bad debt. Hygiene production shouldn't disappear inside total clinical revenue. Lab fees should be connected to the procedures and providers generating them. Capitation and membership plans follow different recognition patterns from fee-for-service insurance.
The problem becomes visible during close. A location may show strong production while collections lag because insurance receipts, patient payments, refunds, and write-offs are being posted to the same income account. A practice may also appear to have rising overhead when the issue is a shift in procedure mix or a provider compensation rule that wasn't tagged correctly.
Controller's rule: If the general ledger can't explain the difference between production and cash, it can't support a useful dental operating review.
A modern dental chart of accounts usually separates preventive, restorative, orthodontic, cosmetic, oral surgery, insurance adjustments, and retail sales. Expenses commonly include staff wages, payroll taxes, benefits, rent, utilities, software, insurance, continuing education, and marketing. That detail matters because dental practices often operate with overhead around 55–65% of collections, making recurring cost movement material to profitability, as described in this dental chart of accounts reference.
For finance leaders replacing QuickBooks or standardizing a DSO, the chart is also a consolidation design. It should let every entity use consistent account definitions while dimensions identify the location, provider, department, and payor. The result is a cleaner close, a more defensible audit trail, and reporting that reflects how the practice earns and spends money. Lucentive's dental office bookkeeping example illustrates why dental organizations outgrow disconnected accounting structures.
Account Numbering and Structural Rules That Scale
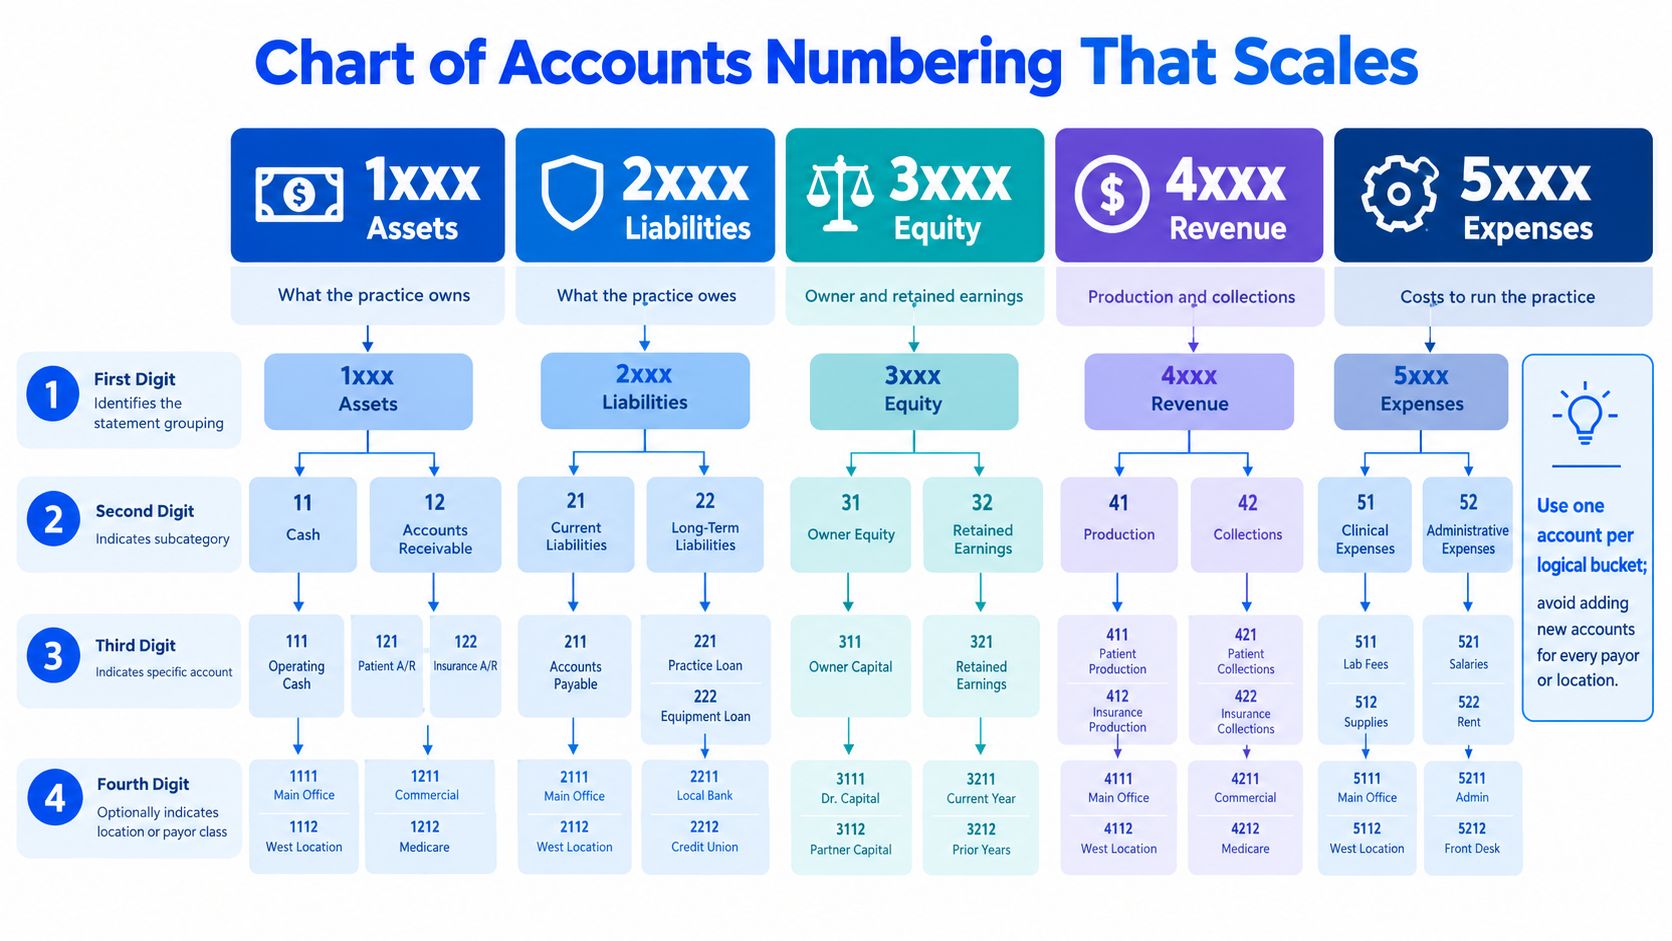
A scalable chart starts with a numbering convention that tells the reader what kind of account they're looking at before opening the detail. A practical four-digit or five-digit structure uses the leading digit for the statement grouping:
- 1xxx, assets: Cash, accounts receivable, inventory, and equipment.
- 2xxx, liabilities: Accounts payable, payroll liabilities, loans, and deferred revenue.
- 3xxx, equity: Capital, retained earnings, distributions, and entity-level equity.
- 4xxx, revenue: Production, collections, adjustments, and other operating income.
- 5xxx, direct costs: Clinical supplies, labs, provider compensation, and other costs tied to care.
- 6xxx and 7xxx, operating expenses: Facilities, administration, technology, marketing, insurance, and professional fees.
The next digit narrows the sub-category. The remaining digits identify the account. For example, 1210 Patient Accounts Receivable and 1220 Insurance Accounts Receivable are more informative than a single “accounts receivable” account, while the location and payor should usually remain dimensions rather than additional account numbers.
Rules that prevent future cleanup
Leave numeric gaps within each grouping. Those spaces let finance add a logical account without renumbering the entire structure. Once an account number is retired, don't reuse it for a different purpose. Historical reports, integrations, and audit support depend on stable account definitions.
Use consistent suffixes for contra-revenue, clearing, and intercompany accounts. Lock the chart after go-live so users can't create ad-hoc accounts every time a new payor or vendor appears.
The account number should identify the economic category. Class, location, department, provider, and payor should add analytical detail on each transaction. That approach supports consolidation across entities and keeps the core chart readable as the organization grows.
Revenue Accounts for Production and Net Collections
A single dental revenue account hides the exact margin problem the CFO needs to see. A practice can produce valuable care, record contractual adjustments, receive partial insurance payments, collect patient balances, and process refunds in the same period. If those events collapse into one line, management can't distinguish weak collection performance from normal payer adjustments.
The revenue section should contain four distinct groups:
- Production accounts record gross fees at the time of service. Clinical categories can include diagnostic, preventive, restorative, endodontics, periodontics, oral surgery, implants, orthodontics, and adjunctive services.
- Collections accounts capture cash received from insurance and patients. These accounts should reconcile to deposits and payment batches.
- Contra-revenue accounts record PPO contractual adjustments, fee-schedule differences, bad debt, courtesy discounts, staff adjustments, refunds, and other reductions separately.
- Non-fee-for-service revenue captures capitation, membership plans, and third-party financing proceeds that don't behave like ordinary insurance receipts.
This structure lets a controller calculate net collections, adjustment rate, and collection percentage by payor without rebuilding journal entries after close. It also preserves the distinction between what the practice performed and what the payer or patient paid.
| Account Group | Purpose | Example Accounts | Reports Enabled |
|---|---|---|---|
| Production | Records gross clinical fees by service family | Diagnostic production, hygiene production, restorative production, orthodontic production | Production by provider, department, and procedure |
| Collections | Records cash received | Insurance collections, patient collections, financing receipts | Cash collections by source and location |
| Contra-revenue | Records reductions to gross revenue | PPO adjustments, bad debt, refunds, courtesy discounts | Net collections and adjustment analysis |
| Other revenue | Records nontraditional revenue streams | Capitation earned, membership revenue, retail sales | Revenue by contract and service model |
Dental accounting guidance emphasizes separating insurance collections, patient collections, other collections, write-offs, courtesy discounts, bad debt, and refunds so net collections aren't overstated. The dental bookkeeping guidance from Ledgerfi also supports production segmentation by provider and procedure family.
Payor Buckets for Insurance, Patient, and Membership Revenue
Payor reporting becomes useful when the account structure reflects how money arrives. Fee-for-service insurance, PPO contracted plans, HMO or capitation arrangements, Medicaid, patient self-pay, in-house membership plans, and third-party financing shouldn't be mixed into one “dental income” account.
A workable arrangement can use discrete revenue accounts in the 4100s for insurance and other payor classes, a parallel 4150 series for patient portions, and a 4200 series for PPO contractual adjustments. Those ranges are editorial design examples for a scalable structure, not universal coding requirements. The important rule is consistency.
Every revenue line should carry a payor-class dimension. That lets the finance team slice collections-to-production reports without reclassifying journal entries. Across states, a separate payor-class segment can prevent Medicaid identifier differences from fragmenting the core revenue definitions.
Capitation requires particular care. Cash received before the practice earns the related service belongs in a prepaid or deferred-revenue liability, not immediately in earned capitation revenue. Membership revenue should be recognized over the service period rather than at billing, so renewals don't create artificial monthly spikes.
Third-party financing also deserves its own treatment. Proceeds from CareCredit, Sunbit, and LendingClub should remain mapped to the originating patient account instead of being commingled with insurance. Financed receivables have different aging and recourse considerations, and that distinction matters during reconciliation.
| Account Range | Payor Bucket | Purpose / Notes |
|---|---|---|
| 4100–4149 | Insurance and contracted payors | Separate fee-for-service insurance, PPO, HMO, and Medicaid classes |
| 4150–4199 | Patient portion | Track self-pay and patient responsibility separately |
| 4200–4249 | PPO contractual adjustments | Show fee-schedule reductions as contra-revenue |
| 4250–4299 | Capitation and membership | Separate earned revenue from prepaid amounts |
| 4300–4349 | Third-party financing | Track financing proceeds against the originating patient account |
The broader principle is supported by this dental chart of accounts template, which recommends separate streams for insurance payments, patient payments, and third-party financing proceeds.
Direct Expenses Tied to Clinical Production
Direct costs should follow the provider and procedure that generate them. Otherwise, the practice can see total expense but not the economics of a dentist, specialty, or chair schedule.
Clinical supplies can sit in the 5300s, with sub-accounts for composites, bonding agents, anesthetics, impression materials, sutures, and small equipment below the capitalization threshold. Dental lab fees can occupy the 5400 range, divided between fixed and removable labs. Tag the producing dentist and procedure category so lab-to-production ratios surface by provider rather than only at the practice level.
Imaging and consumables belong in a separate range, such as 5500, for film, sensor replacements, developer chemicals, and CBCT scan fees. Provider compensation can sit in 5600, but W-2 wages, guaranteed draws, production bonuses, and 1099 contract dentist earnings should never be combined. Each compensation type affects labor analysis differently.
| Account Range | Direct Expense Category | Required Dimension / Tag |
|---|---|---|
| 5300–5399 | Clinical supplies | Provider, location, procedure category |
| 5400–5499 | Dental lab fees | Producing provider, lab type, procedure family |
| 5500–5599 | Imaging and clinical consumables | Location, department, service category |
| 5600–5699 | Provider compensation | Provider ID, compensation type, location |
| 5700–5799 | Other production-linked costs | Provider, service line, department |
A provider-level P&L only works when the transaction carries the right dimensions at entry. If the accounts show lab fees but the journal lacks provider or procedure tags, the report can't support coaching, compensation recalibration, or service-line profitability review.
Operating Expenses Mapped to Overhead Benchmarks
The operating expense section should mirror the categories management already uses in budget reviews. Facility costs can occupy the 6000s, with separate accounts for rent and CAM, utilities, janitorial services, repairs, and depreciation. Keep depreciation on dental chairs, sterilizers, and 3D printers distinct from real-estate depreciation, particularly when the organization evaluates an asset sale or location transaction.
Administrative overhead can span 6100–6300 and include office supplies, software subscriptions, postage, printing, merchant processing fees by merchant bucket, and bank charges. Marketing can sit in 6400, divided between patient reactivation, external digital campaigns, and community referral costs. Legal, accounting, payroll processing, and consulting belong in 6500, while malpractice, property, and workers' compensation should remain distinct within 6600.
Common benchmark ranges give these accounts management context. One dental accounting guide identifies office expense at roughly 4–6% of collections, facility costs at 5–7%, marketing at 3–5%, and lab fees at 7–10%, as shown in this dental overhead benchmark guide.
| Account Range | Operating Expense Bucket | Healthy Range (% of Collections) |
|---|---|---|
| 6000–6099 | Facility costs | 5–7% |
| 6100–6399 | Office and administrative expense | 4–6% |
| 6400–6499 | Marketing | 3–5% |
| 6500–6599 | Professional fees | Practice-specific |
| 6600–6699 | General insurance | Practice-specific |
| 5400–5499 | Lab fees | 7–10% |
The chart doesn't make a category healthy. It makes drift visible early enough to investigate. A controller can compare locations, isolate a subscription or staffing issue, and distinguish a genuine cost increase from a coding change. For broader healthcare reporting considerations, finance leaders can also review Lucentive's healthcare financial metrics guide.
Payroll, Benefits, and Provider Compensation Accounts
People costs need more structure than one wages account. Gross wages should be separated by role, including hygienists, assistants, front-desk staff, sterilization technicians, treatment coordinators, and office managers. Employer payroll taxes should be identifiable by FUTA, SUTA, FICA, and Medicare, while benefits should distinguish medical, staff dental, vision, life insurance, 401(k) match, and HSA contributions.
Workers' compensation belongs in its own account and should carry the relevant class code. That makes premium audits easier and prevents insurance expense from becoming an unexplained practice-level total.
Provider compensation needs a separate family from clinical staff wages. Base salary, hourly pay, commission or collections bonuses, production bonuses, draws, and guaranteed payments should each have a clear account. Contract labor and temporary providers paid through 1099-NEC reporting also need distinct treatment, as do malpractice insurance, continuing-education reimbursements, and license or fee reimbursements.
| Account # | Account Name | Use Note |
|---|---|---|
| 5610 | Provider base salary | Fixed provider compensation |
| 5620 | Provider hourly compensation | Hours-based clinical pay |
| 5630 | Collections bonus | Pay tied to collections |
| 5640 | Production bonus | Pay tied to production |
| 5650 | Guaranteed draw | Separate from variable compensation |
| 5660 | Contract dentist labor | 1099 provider earnings |
| 6210 | Clinical staff wages | Hygienists, assistants, and clinical support |
| 6220 | Front-office wages | Reception, billing, and treatment coordination |
| 6230 | Employer payroll taxes | Tax expense by entity or location |
| 6240 | Employee benefits | Benefits by plan type |
Related payables should carry provider ID, location, department, and payor class where relevant. Lumping all wages into one account breaks production-per-provider analytics and makes compensation review dependent on spreadsheets.
Payroll integrations can help, but the account mapping still needs ownership. Lucentive's Sage Intacct and ADP integration discussion is relevant when finance leaders want payroll data to flow into a controlled ERP structure instead of being re-entered manually.
Cost Centers, Locations, and Funds for Multi-Site Practices
At two locations, adding accounts for each site may seem manageable. At forty, consolidation becomes slow and fragile. Keep the GL account focused on what was purchased or earned, then use dimensions to show where, who, and why the transaction occurred.
Use classes for departments or clinical groupings such as general dentistry, hygiene, orthodontics, periodontics, administration, and marketing. Use locations or entities for each practice site. Apply fund or restricted-cash tags to landlord escrows, credit-card reserves, or owner draws when those balances must remain separate from ordinary operating activity.
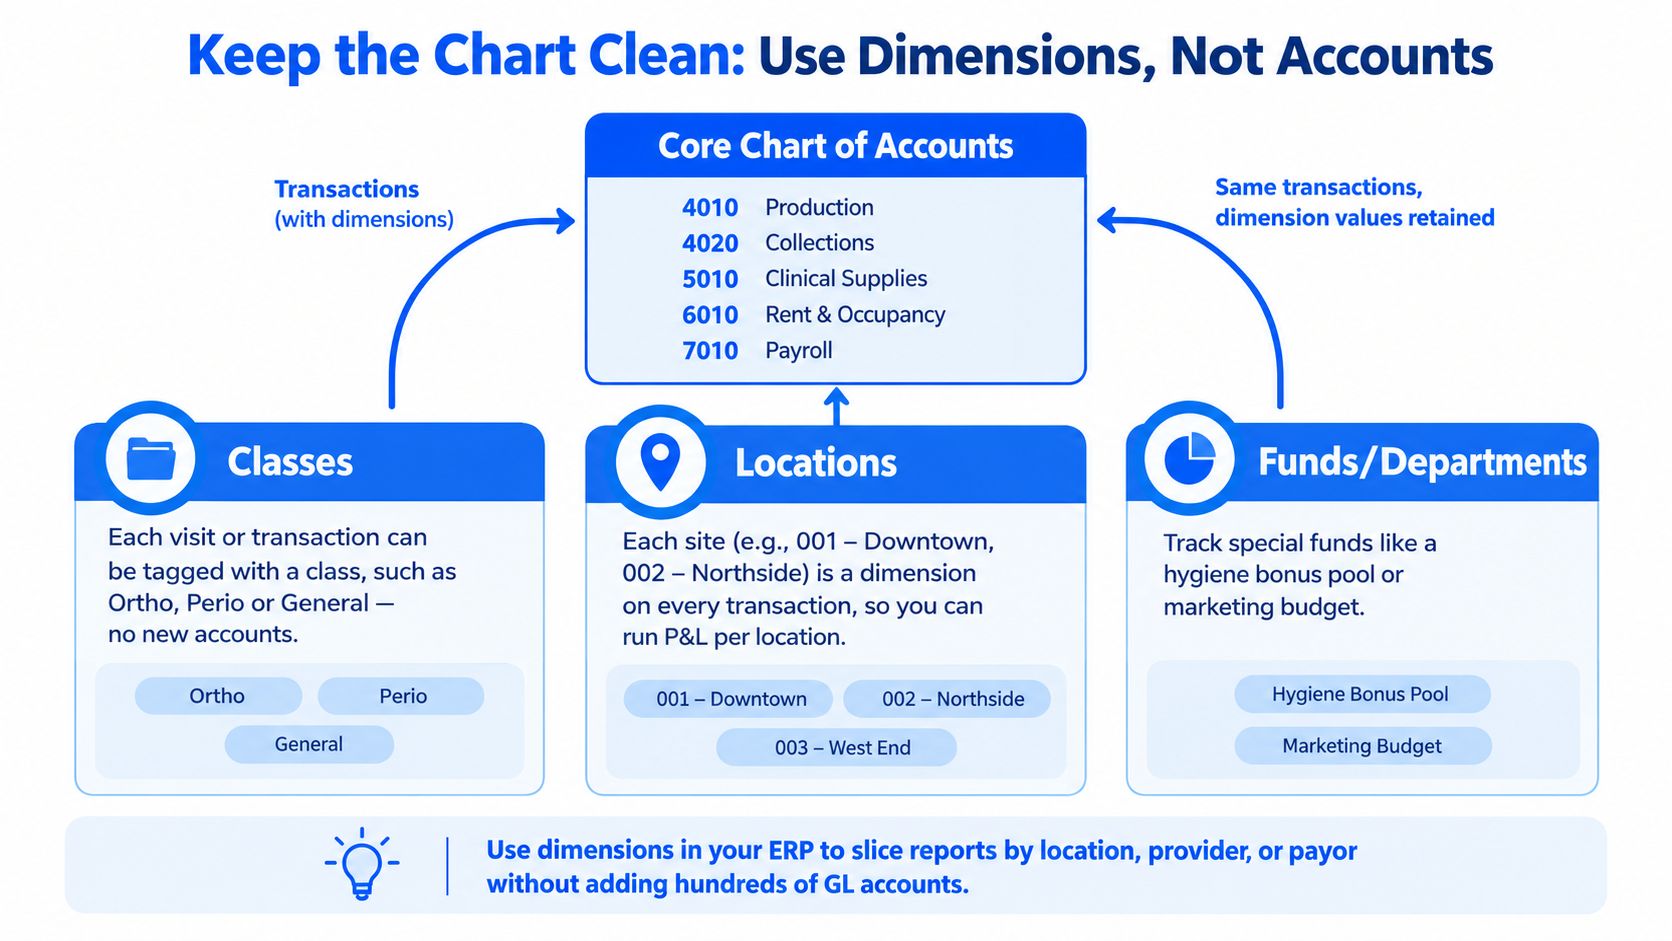
A single operating entity can often run one core chart with location and department dimensions. A DSO needs a defined entity model. Each operating entity may maintain its own chart instance or account segment, while consolidated reporting sits above the entities. Due-to and due-from accounts should be explicit. Intercompany management fees also need consistent definitions, so eliminations do not depend on manual interpretation.
That structure protects revenue-integrity reporting. Production, collections, PPO write-offs, and lab costs can be analyzed by location or department without multiplying accounts, making margin pressure visible instead of burying it in consolidated totals.
Design trade-off: One account list can serve a two-location practice. A forty-location DSO needs entity governance, controlled segments, and consolidation rules. The wrong compromise overcomplicates a small practice or leaves a growing group unable to explain its results.
Lucentive's dental office accounting example reflects the operational value of standardizing accounting detail while keeping reporting dimensions separate from the core account list.
Sample Account List at a Glance
A sample list should show the structure without pretending every practice needs identical accounts. The following representative layout uses 1000–1999 for assets, 2000–2999 for liabilities, 3000–3999 for equity, 4000–4999 for revenue, 5000–5999 for direct costs, 6000–7999 for operating expenses, 8000–8999 for other income and expense, and 9000–9999 for memo accounts.
“Dimension” indicates that the account commonly carries a location, class, provider, department, or payor tag.
| Range | Group | Sample Accounts |
|---|---|---|
| 1000–1999 | Assets | 1010 Operating Cash, 1020 Payroll Cash, 1110 Patient A/R, 1120 Insurance A/R, 1210 Inventory, 1310 Dental Equipment, 1320 Accumulated Depreciation |
| 2000–2999 | Liabilities | 2010 Accounts Payable, 2110 Payroll Taxes Payable, 2120 Benefits Payable, 2210 Deferred Membership Revenue, 2310 Current Loans, 2410 Due to Affiliates |
| 3000–3999 | Equity | 3010 Owner Capital, 3020 Additional Paid-In Capital, 3110 Retained Earnings, 3210 Owner Distributions, 3310 Current-Year Earnings |
| 4000–4999 | Revenue | 4010 Diagnostic Production, 4020 Preventive Production, 4030 Restorative Production, 4100 Insurance Collections, 4150 Patient Collections, 4250 PPO Adjustments, 4300 Membership Revenue, 4400 Retail Sales |
| 5000–5999 | Direct Costs | 5310 Clinical Supplies, 5410 Fixed Lab Fees, 5420 Removable Lab Fees, 5510 Imaging Consumables, 5610 Provider Salary, 5630 Production Bonuses, 5710 Chair-Linked Costs |
| 6000–7999 | Operating Expenses | 6010 Rent and CAM, 6020 Utilities, 6110 Office Supplies, 6210 Software, 6310 Merchant Fees, 6410 Marketing, 6510 Accounting Fees, 6610 Malpractice Insurance |
| 7000–7999 | Payroll and Benefits | 7010 Clinical Staff Wages, 7020 Front-Office Wages, 7030 Employer Payroll Taxes, 7040 Medical Benefits, 7050 Retirement Match, 7060 Workers' Compensation |
| 8000–8999 | Other Income and Expense | 8010 Interest Income, 8110 Interest Expense, 8210 Gain or Loss on Equipment, 8310 Other Nonoperating Expense |
| 9000–9999 | Memo Accounts | 9010 Gross Production Memo, 9020 Adjusted Production Memo, 9030 Provider Production Memo, 9040 Chair Utilization Memo |
The sample follows the broader evolution of dental charts toward granular production and operating accounts. Historical templates have moved from simple ledgers to structures with 100+ individual accounts, while a QuickBooks Online dental template uses a 120-account practice structure, as documented by this dental chart template from ProAxis CPA. Those figures show the level of detail commonly used, not a required account count.
Implementing the Chart of Accounts in a Cloud ERP
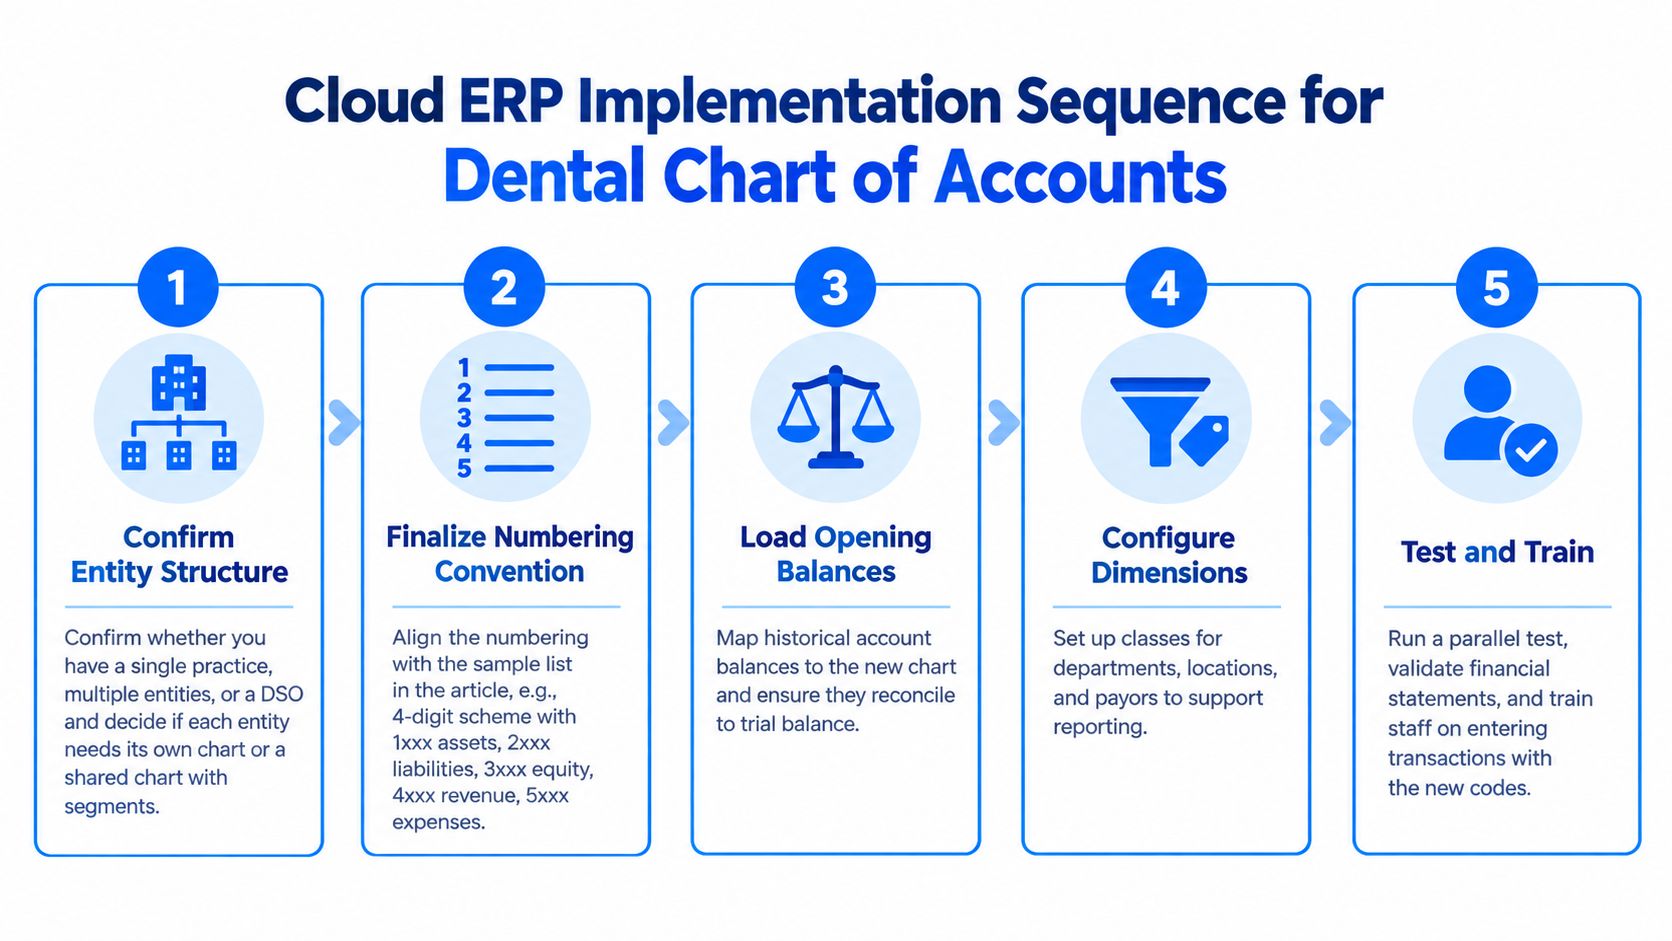
A finance lead can hand the implementation partner a sequence that starts with reporting requirements, not data loading.
- Confirm the entity structure. Identify whether the organization is a single practice, multiple operating entities, or a DSO. Decide whether entities need separate charts or a shared structure with controlled segments.
- Finalize the numbering convention. Align the account list to the statement groupings and reserve gaps for future additions.
- Define dimensions. Establish class, location, department, provider, and payor values before importing transactions.
- Map the subledgers. Decide whether production, payments, payroll, and accounts receivable will feed the GL through practice-management integrations or controlled journal entries.
- Load and validate opening balances. Map historical accounts, reconcile the imported balances to the trial balance, and test production, collections, adjustments, and write-off mappings before the first live close.
User acceptance should be report-based. The system should produce clean net collections by payor and location, location-level P&Ls, and provider compensation reports tied to the account and dimension design. It should also preserve the history of adjustments and opening balances instead of forcing finance to maintain an external reconciliation workbook.
Sage Intacct's general ledger capabilities can support the controlled account and dimension model, but software alone doesn't decide how a practice recognizes membership revenue, maps PPO adjustments, or handles intercompany management fees. That's where implementation judgment affects time-to-value and audit readiness. Lucentive is a Sage Intacct National Premier Partner with experience across mid-market organizations, healthcare, and nonprofits, making it a practical option for finance leaders evaluating the partner as carefully as the ERP.
Summary
A dental practice chart of accounts should separate production, collections, adjustments, and contra-revenue so finance can see net collections by location and payor. A stable numbering convention supports growth across clinics and entities, while dimensions carry provider, department, location, and service detail without duplicating account strings. Direct costs, operating expense buckets, payroll, and provider compensation also need distinct accounts. That structure gives a single-site practice or DSO a clearer close process, stronger audit support, and the reporting backbone needed to understand margin.
Frequently Asked Questions
What makes a dental practice chart of accounts different from a generic chart?
Dental practices need to distinguish production from collections and separate PPO adjustments, bad debt, refunds, and discounts. They also need clinical revenue by service family, direct costs such as lab fees and supplies, and provider compensation by type. Generic charts tend to collapse these activities into broad income and expense accounts, which prevents useful analysis of payor mix, provider performance, and location-level profitability.
Should insurance and patient payments use separate accounts?
Yes. Insurance payments, patient payments, and third-party financing proceeds should be recorded in separate revenue streams. A payor-class dimension can add detail without creating a new account for every plan. This structure helps finance reconcile deposits, compare collections with production, analyze adjustment patterns, and keep financing receipts separate from insurance activity.
Should locations be separate GL accounts?
Usually, locations should be dimensions rather than separate revenue and expense accounts. The account identifies the economic category, while the location dimension identifies the site. That keeps the chart easier to consolidate and lets finance produce location-level P&Ls. A DSO may still use separate entity charts or account segments when legal entities require distinct books and intercompany eliminations.
How should provider compensation be organized?
Provider compensation should use dedicated accounts for base salary, hourly pay, collections bonuses, production bonuses, draws, guaranteed payments, and contract dentist labor. It shouldn't be combined with clinical staff wages. Provider ID, location, department, and relevant payor or service dimensions should accompany the transactions so compensation reports reconcile to production and support meaningful provider-level analysis.
What should be tested before the first ERP close?
Test the revenue and cost flows that management will rely on. Confirm that production, insurance collections, patient collections, PPO adjustments, refunds, lab fees, payroll, and provider compensation map to the intended accounts and dimensions. Then validate opening balances against the trial balance and confirm that net collections, location P&Ls, and provider compensation reports work without manual reclassification.
Lucentive helps finance leaders design dental and DSO account structures, configure Sage Intacct dimensions, and connect the ERP implementation to practical reporting needs. Schedule a 30-minute working session through Lucentive to review your current chart, reporting gaps, and whether Sage Intacct is a fit for your organization.