A multi-location dental group closes its books three weeks late. By the time the Controller sees that one site's collections have slipped, the cash is already gone. The warning signs sit in a handful of numbers, but those numbers live across the practice management system, payroll, and the general ledger. Nobody sees the full picture in time to act.
This list covers eight KPIs for dental practice finance, with a practical definition, formula, benchmark where verified guidance exists, measurement cadence, data source, and accountable owner. The focus is decision use. Each metric should answer a cash, margin, capacity, or growth question.
Sage Intacct supplies the financial control layer. It doesn't automatically solve dental data mapping, provider attribution, payer reconciliation, or location reporting. Those decisions must be designed before deployment. Lucentive, a Sage Intacct National Premier Partner with mid-market, healthcare, and nonprofit experience, helps finance teams connect operational data to a usable reporting model.
Table of Contents
- 1. Production Revenue Per Provider
- 2. Patient Realization Rate
- 3. Accounts Receivable Aging and Days in Receivables
- 4. Patient Acquisition Cost and Cost Per New Patient
- 5. Clinical Utilization Rate
- 6. Overhead Ratio
- 7. Patient Retention Rate and Patient Lifetime Value
- 8. Accounts Payable Days Outstanding and Cash Conversion Cycle
- 8 KPIs for Dental Practices, Comparison
- Summary
- Frequently Asked Questions
- What is the most important KPI for a dental practice?
- How often should dental practice KPIs be reviewed?
- What systems supply dental practice KPI data?
- How should a multi-location dental group compare sites?
- Why shouldn't production be treated as cash?
- What should a CFO do before buying ERP software?
1. Production Revenue Per Provider
Production revenue per provider shows how much adjusted clinical revenue each dentist or hygienist generates. Use adjusted production after contractual adjustments and write-offs, then divide by provider clinical days or FTE capacity. For a day-level operating view, benchmark guidance lists approximately $2,500 to $4,000 per clinical day for a general dentist, $3,500 to $6,000 for certain specialists, and $1,000 to $1,500 for a hygienist. These reference points come from dental provider production benchmarks, and they aren't universal targets.
The CFO decision is capacity allocation. A low result can reflect weak demand, poor schedule design, excessive cancellations, a new provider ramping up, or a service mix that doesn't support the site's cost structure. Don't treat the metric as a provider score in isolation. Compare it with completed visits, chair utilization, payer mix, treatment type, collections, and clinical quality indicators. For context on productivity measurement in healthcare, finance teams often align provider reporting with broader productivity analysis principles.
Formula: adjusted production ÷ provider clinical days.
Review frequency: monthly, with rolling-three-month trends.
Primary systems: practice management system for production and provider attribution, Sage Intacct for reconciled financial reporting.
Make provider comparisons fair
Break the number down by provider, location, hygiene, and procedure category. A new associate shouldn't be judged against an established specialist without adjusting for ramp-up time, schedule access, and case mix. A multi-site group should also distinguish a demand problem from a scheduling problem. The same provider can appear unproductive when the site fails to provide adequate exams or treatment opportunities.
The ADA identifies provider productivity, production, collections, profit, overhead, and receivables as foundational dental practice KPIs. Its guidance also recommends reviewing at least the prior three months to establish a baseline before setting improvement targets. See the dental practice chart of accounts guidance when designing the account and dimension structure behind provider reporting.
Finance rule: Production explains work performed. Collections explain cash received. Never use one as a substitute for the other.
2. Patient Realization Rate
Patient realization rate measures how much planned or produced treatment becomes collected revenue. Use a clearly defined denominator, such as adjusted production or accepted treatment scheduled within the measurement period. A practical formula is:
realization rate = actual collections ÷ adjusted production × 100
The cash decision is whether reported clinical activity is converting into usable cash. The ADA recommends that practices aim to collect at least 98% of billable or adjusted production. That figure is a reference point, not a universal law. Payer mix, specialty, geography, write-off policy, and timing can materially change the result. The benchmark is documented in the American Dental Association KPI guidance. Teams that want a broader finance lens can compare this KPI with standard collection ratio concepts.
Review frequency: monthly, with weekly exception alerts for material deterioration.
Primary systems: practice management system for production and collections, clearinghouse and payer data for claims, Sage Intacct for cash reconciliation and financial statements.
A falling realization rate usually points to a process failure. Insurance claims may be delayed. Financial arrangements may be unclear. Patient balances may not be collected at the point of service. Treatment may be accepted but never scheduled or completed. Separate the analysis by payer, location, provider, and procedure type before assigning responsibility.
A strong production report with weak collections is not growth. It's working capital tied up in unresolved balances.
Lucentive's dental technology financial operations example illustrates why operational and accounting data must reconcile. Sage Intacct can provide the financial reporting layer, but the practice management integration must preserve treatment, payer, provider, and location context.
3. Accounts Receivable Aging and Days in Receivables
Accounts receivable aging shows unpaid balances by age. A useful view separates current balances from older categories, including 0 to 30 days, 31 to 60 days, 61 to 90 days, and more than 90 days. Days in receivables measures the average time between completed service and payment.
DSO formula: ending receivables ÷ average daily adjusted collections.
The working-capital decision is straightforward. If receivables age faster than collections, the practice must fund payroll, supplies, and expansion with less cash than its production report suggests. Separate patient A/R from insurance A/R. They require different owners, workflows, and escalation rules. For readers outside healthcare finance, this is closely related to standard days sales outstanding analysis.
Review frequency: weekly for aging exceptions, monthly for trend analysis.
Primary systems: practice management and claims systems for balances and claim status, Sage Intacct for the control account, cash forecast, and reconciliation.
A CFO should ask three questions. Which locations carry the oldest balances? Which payers delay reimbursement? Which front-office processes create avoidable leakage? The answer often sits outside the ledger. A general ledger can show the balance, but it won't explain whether a claim lacks documentation or whether a patient never received a statement.
Assign action by aging bucket
Use aging to trigger action, not just reporting. Claims that remain unresolved need a payer follow-up owner. Patient balances need clear communication and payment workflows. Older balances need escalation according to the organization's policy and applicable rules.
The healthcare financial metrics guide from Lucentive is relevant when aligning A/R reporting with cash-flow management. The dashboard should show gross receivables, aging mix, collections, adjustments, and cash received. Report by site and payer, then reconcile the total to Sage Intacct.
4. Patient Acquisition Cost and Cost Per New Patient
Patient acquisition cost tells the CFO what the organization pays to create a new-patient relationship. Include the relevant marketing and acquisition spend, then divide it by new patients acquired during the same period.
PAC formula: marketing and acquisition spend ÷ new patients acquired.
The growth decision is channel allocation. A low-cost channel isn't automatically better if it produces patients who don't attend, accept treatment, return for preventive care, or pay reliably. Pair PAC with attended exams, treatment acceptance, completed treatment, retention, and collected revenue. Segment by location and source, including referrals, community partnerships, paid search, direct mail, and other identifiable channels. This KPI is often evaluated alongside broader customer acquisition cost concepts.
Review frequency: monthly for spend and volume, quarterly for channel quality and retention.
Primary systems: marketing platforms and call tracking for source data, practice management system for new-patient and attendance data, Sage Intacct for spend and margin reporting.
A finance leader should insist on a patient-conversion waterfall:
- Inquiries: count qualified contacts by source.
- Booked exams: measure access and front-desk conversion.
- Attended exams: isolate attendance from booking.
- Diagnosed treatment: measure clinical opportunity.
- Accepted treatment: measure patient decision-making.
- Scheduled treatment: identify booking leakage.
- Completed treatment: confirm operational follow-through.
- Collected revenue: connect growth to cash.
This model is more useful than a single acquisition number. Industry data cited in the 2025 dental industry outlook reports that 41.2% of practices had fewer than 19 new patients per month, while 16.6% had more than 80. The same source reports 15.5% of patients canceled in advance and 7.4% failed to show without notice. Those figures demonstrate why source volume alone doesn't explain growth.
5. Clinical Utilization Rate
Clinical utilization rate measures the share of available chair or operatory time used for patient care.
Formula: billable clinical hours ÷ total available clinical hours × 100.
The capacity decision is whether the practice needs more demand, better scheduling, or more space. Measure utilization by provider, location, day, time block, and appointment type. High utilization with weak production can indicate low-value scheduling or poor payer economics. Low utilization with strong demand may indicate access bottlenecks or insufficient staffing. At a broader level, this echoes standard capacity utilization analysis.
Review frequency: weekly for operating action, monthly for finance reporting.
Primary systems: practice management and scheduling systems for available and occupied time, Sage Intacct for production, collections, and contribution reporting.
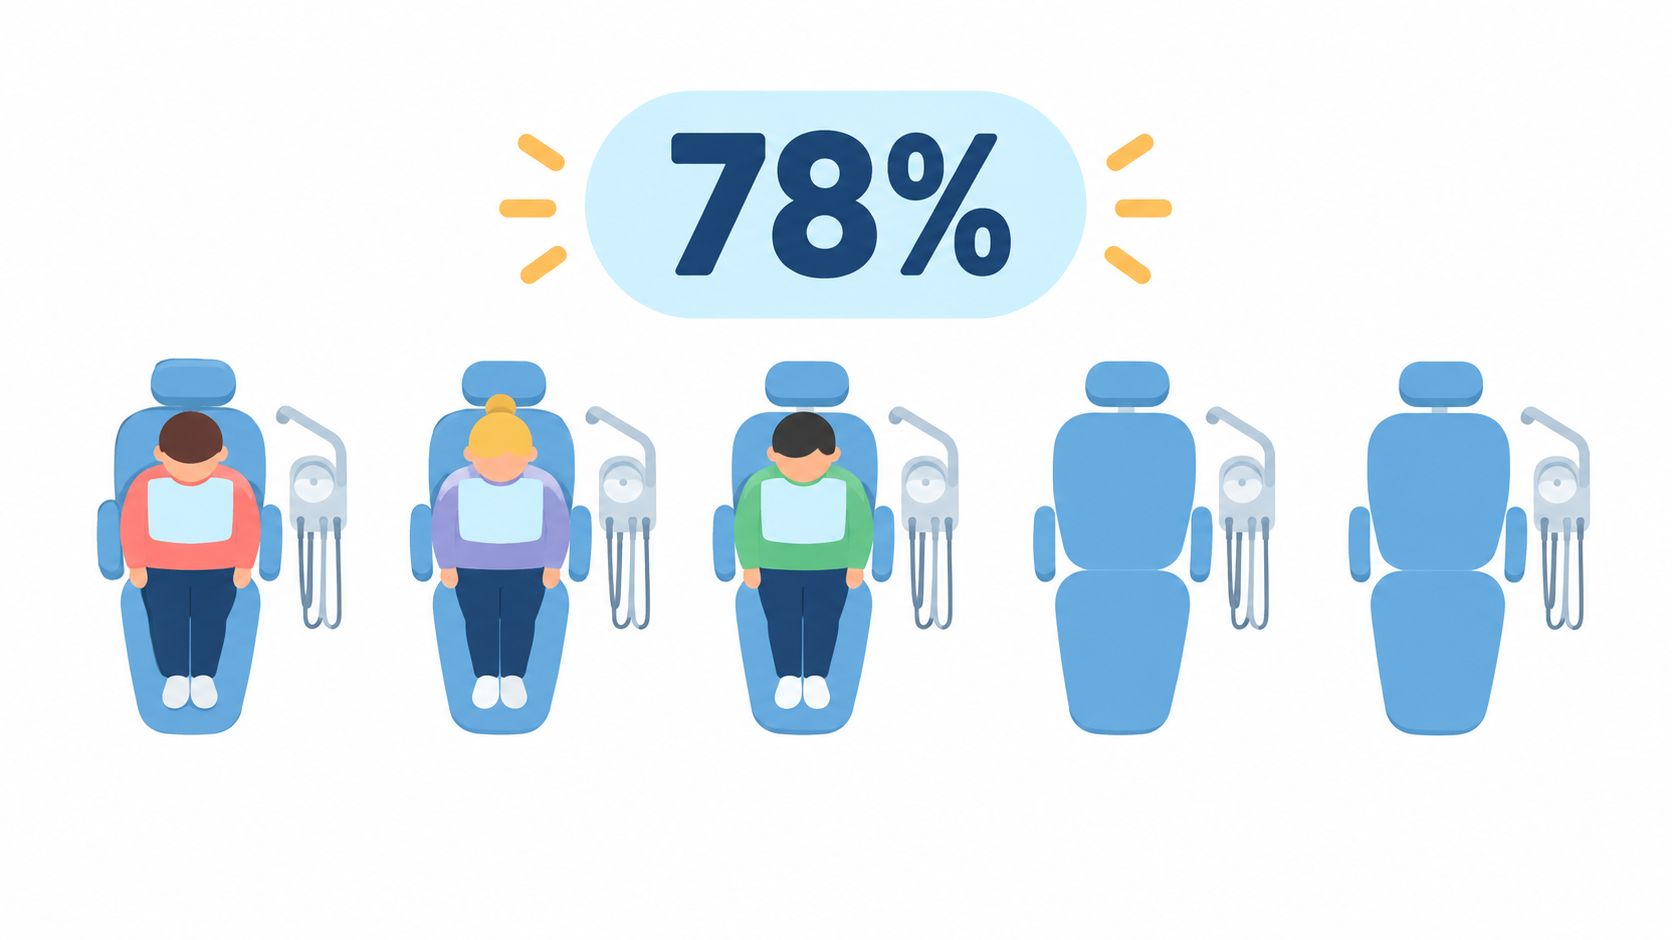
Missed visits deserve separate treatment. A peer-reviewed study of 196,018 dental appointments classified 42.68%, or 83,663 appointments, as no-shows in its studied dataset. The research also notes that reported rates can reach 80% in some settings, while a systematic review found rates ranging from 13.5% to 48%. These results come from the peer-reviewed dental no-show research. Use them as evidence of variation, not as a target for every practice.
Track scheduled visits, completed visits, cancellations, late cancellations, no-shows, rebookings, and backfilled chair time. Estimate the financial effect as scheduled production less recovered production. The clinical effect may include delayed preventive care and missed treatment diagnosis.
Utilization is a capacity metric, not a license to overbook care. Pair it with attendance, patient experience, and clinical quality.
6. Overhead Ratio
Overhead ratio measures operating expenses as a share of collections. The correct formula is:
overhead ratio = total operating expenses ÷ total collections × 100
Don't divide operating expenses by gross production or billed charges. Production includes contractual adjustments, write-offs, and amounts not yet collected, which can make overhead appear artificially low. The cash basis is more useful for judging whether the practice can fund payroll, distributions, debt service, and growth.
The ADA reference point places overhead generally at or below 63% of total income. Another benchmark framework describes typical overhead around 60% to 65% of collections, with category ranges that include staff costs of approximately 25% to 30%, clinical supplies at 4% to 6%, facility costs at 6% to 10%, and laboratory and supply costs together at 6% to 8%. These figures are reference frameworks, not universal operating rules. The denominator and category definitions must remain consistent. See the dental overhead benchmark explanation. Readers who want a non-dental analogue can compare this to standard operating expense ratio thinking.
Review frequency: monthly, with rolling-three-month and year-to-date views.
Primary systems: Sage Intacct for the expense ledger, payroll for labor detail, procurement and practice management systems for supplies and clinical activity.
Diagnose the margin problem correctly
A rising ratio can come from lower collections, higher labor, supply waste, excess space, or temporary staffing. Break overhead into controllable and structural categories. A mature site and a startup site shouldn't be ranked on one monthly league table. A rural, labor-intensive, Medicaid-heavy, or access-focused practice may have a different cost structure than a private specialty location.
Lucentive's Sage Intacct guidance for dental service organizations is relevant for multi-site reporting. Standardize account definitions, location dimensions, provider attribution, and allocation rules before comparing margins. Otherwise, the dashboard creates false precision.
7. Patient Retention Rate and Patient Lifetime Value
Retention rate measures whether patients who were active in a prior period return within the defined follow-up window.
Formula: prior-period active patients who remain active ÷ prior-period active patients × 100.
Patient lifetime value estimates the economic value of the relationship:
LTV = average transaction value × purchase frequency × customer lifespan minus acquisition cost
The growth decision is whether the organization is building durable demand or replacing churn with expensive acquisition. Retention should be segmented by acquisition source, payer, location, provider, treatment category, and access experience. A patient who leaves because of cost creates a different intervention from a patient who leaves because they couldn't obtain an appointment. For a broader finance and marketing framework, this aligns with standard customer lifetime value analysis.
Review frequency: quarterly, using a consistent 12-month window.
Primary systems: practice management system for visits and recall, patient experience tools for feedback, Sage Intacct for revenue, margin, and acquisition-cost reporting.
Don't use retention as a standalone financial score. Review it with patient satisfaction, reappointment, appointment lead time, completed care, and provider continuity. A patient survey of 1,005 U.S. adults who had visited a dentist within two years found that 76% were satisfied or very satisfied with their previous visit, while 55% reported dental anxiety. Those findings are reported in the 2024 dental technology survey. They support a broader view of retention. Convenience and communication can matter alongside price and clinical outcomes.
A practical scenario: one location retains patients well but produces little completed treatment because appointments are difficult to schedule. Another has strong treatment acceptance but weak return visits because provider turnover disrupts continuity. Both need different operating responses.
8. Accounts Payable Days Outstanding and Cash Conversion Cycle
Accounts payable days outstanding measures how long the organization takes to pay suppliers.
DPO formula: accounts payable balance ÷ total daily purchases × days in the period.
The cash conversion cycle combines receivables, inventory, and payables:
CCC = DSO + DIO minus DPO
For a supply-heavy dental organization, DIO can capture cash held in clinical inventory. The liquidity decision is whether growth is consuming cash faster than collections replenish it. A rising CCC can indicate slower collections, excess stock, or supplier payments made earlier than necessary. Readers who want a standard finance reference can compare these measures with days payable outstanding and the cash conversion cycle.
Review frequency: monthly, with weekly cash-position monitoring during periods of expansion or liquidity pressure.
Primary systems: Sage Intacct for bills, payment timing, and cash, procurement or inventory systems for purchases and stock, practice management and claims systems for DSO.
Don't stretch vendors carelessly. Negotiate terms based on volume, reliability, and supplier relationships. Review early-payment discounts against the organization's cost of capital. Also segment DPO by supplier category. A distributor may offer flexibility that a clinical service provider doesn't.
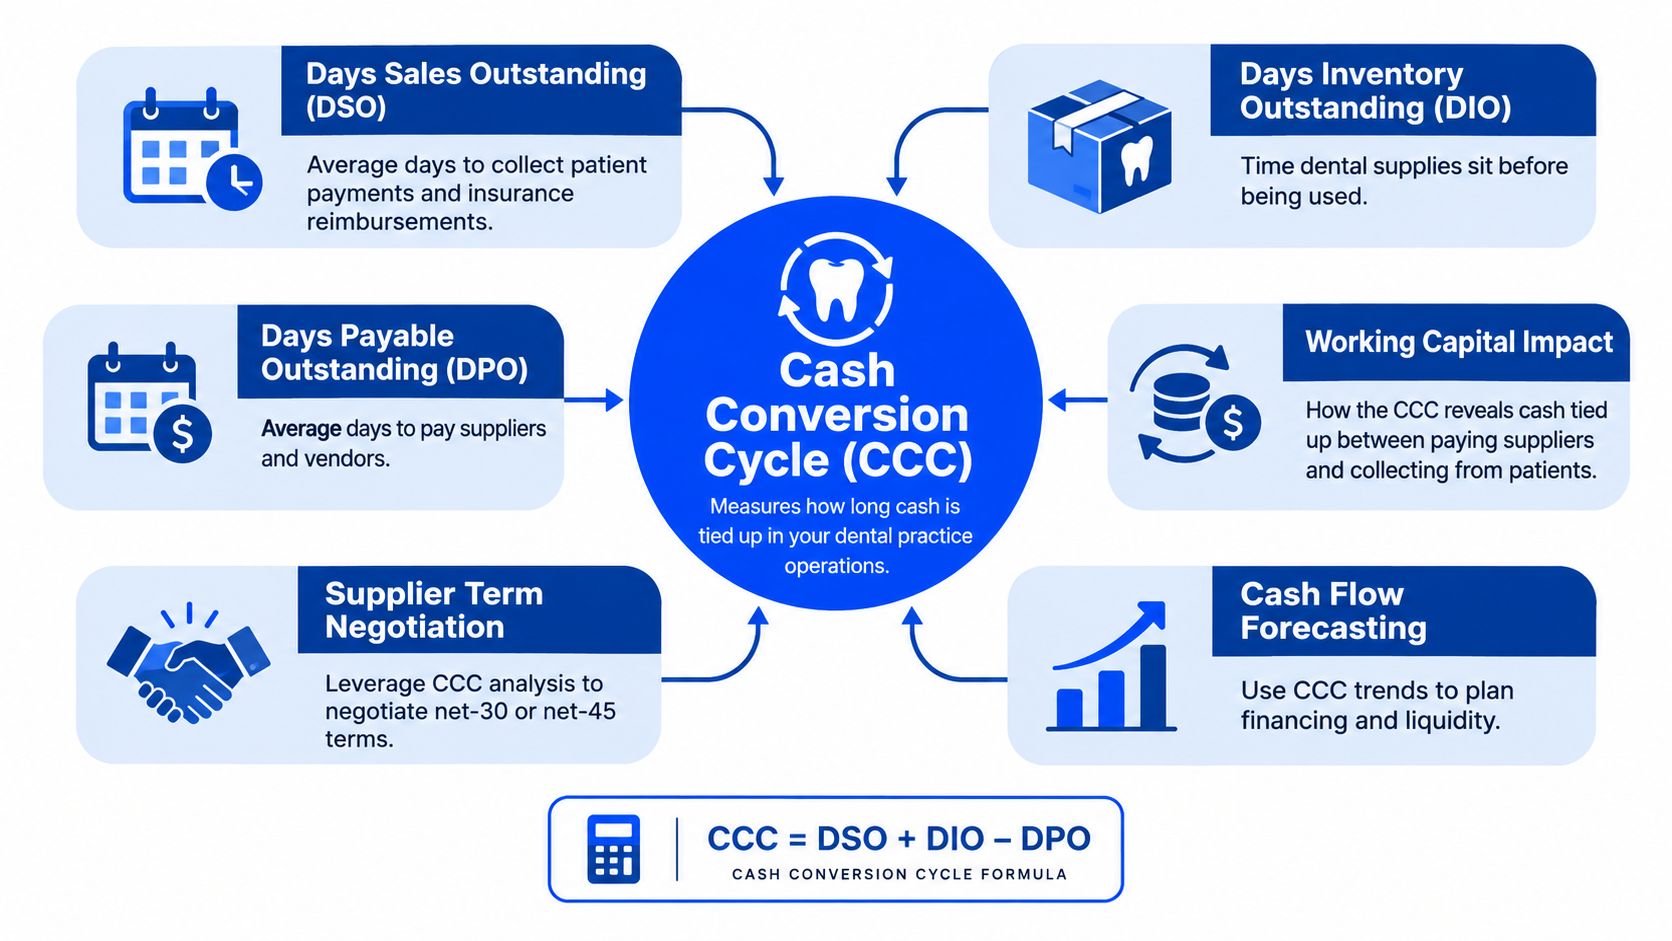
A multi-site group should connect CCC to the cash forecast, not bury it in a month-end report. The dental office accounting close example from Lucentive reinforces the operating point: finance leaders need timely, reconciled data before they can make credible liquidity decisions.
8 KPIs for Dental Practices, Comparison
| KPI | Implementation Complexity 🔄 | Resource Requirements ⚡ | Expected Outcomes 📊 | Ideal Use Cases 💡 | Key Advantages ⭐ |
|---|---|---|---|---|---|
| Production Revenue Per Provider | 🔄 Medium, needs FTE and production data consolidated | ⚡ Moderate, practice-management + time/production coding | 📊 Clear provider productivity insights; supports revenue growth | 💡 Benchmarking across providers/locations; compensation design | ⭐ Directly ties clinical activity to profitability |
| Patient Realization Rate | 🔄 Medium, match treatment plans to actual collections | ⚡ Moderate, treatment plan + collections data, timely updates | 📊 Improves revenue conversion and forecasting accuracy | 💡 Diagnose case acceptance, financial counseling gaps | ⭐ Measures effectiveness of case presentation and collections |
| A/R Aging & Days in Receivables (DSO) | 🔄 High, requires timely, accurate receivable recording | ⚡ High, billing follow-up, accounting integration, reporting | 📊 Better cash-flow visibility; reduces bad debt risk | 💡 Weekly collections management; CFO working-capital oversight | ⭐ Early detection of collection issues; actionable aging buckets |
| Patient Acquisition Cost (PAC) & Cost Per New Patient | 🔄 High, multi-channel attribution is complex | ⚡ High, marketing spend tracking + patient source data | 📊 Optimizes marketing ROI and budget allocation | 💡 Channel performance analysis for growth and scaling | ⭐ Enables cost-effective patient acquisition decisions |
| Clinical Utilization Rate (Chair/Operatory Utilization) | 🔄 Medium, requires scheduling and billable hours linkage | ⚡ Moderate, scheduling system + simple analytics | 📊 Unlocks revenue from existing capacity; reduces idle time | 💡 Improve scheduling, reduce cancellations, raise utilization | ⭐ High-impact, actionable KPI for profitability gains |
| Overhead Ratio (Operating Expenses % of Revenue) | 🔄 Medium, consolidates expenses across categories | ⚡ Moderate, accounting consolidation and categorization | 📊 Reveals margin health and areas for cost control | 💡 Margin management, site-level cost comparisons | ⭐ Comprehensive view of operational efficiency and profit |
| Patient Retention Rate & LTV | 🔄 High, requires long-term patient and revenue linkage | ⚡ High, patient history, revenue data, cohort analysis | 📊 Predictable long-term revenue and ROI for retention efforts | 💡 Prioritize retention programs over costly acquisition | ⭐ Quantifies lifetime profit and supports strategic investment |
| A/P Days Outstanding & Cash Conversion Cycle (CCC) | 🔄 High, combines payables, receivables, (and inventory) | ⚡ Moderate, AP process, inventory tracking, cash forecasting | 📊 Improves working-capital management and liquidity | 💡 Supplier negotiation, cash-flow planning, centralized AP | ⭐ Holistic view of cash timing; identifies liquidity levers |
Summary
The most useful KPIs for dental practice finance connect operations to cash and margin. Production per provider measures clinical capacity. Realization rate tests conversion into collections. A/R aging exposes working-capital leakage. Patient acquisition cost tests growth efficiency. Utilization shows whether chairs are productive. Overhead protects margin. Retention and lifetime value measure durable growth. A/P days and the cash conversion cycle show liquidity pressure. Sage Intacct can centralize financial reporting, but dental data must be mapped, reconciled, and segmented by provider, payer, and location. For broader finance context, teams often align these measures with accounts receivable turnover, operating margin, and working capital concepts.
Frequently Asked Questions
What is the most important KPI for a dental practice?
There isn't one universal KPI. CFOs should start with the decision under pressure. Collections and realization rate matter when cash is tight. Overhead matters when margin is falling. Production per provider and utilization matter when capacity is underused. A/R aging matters when reported revenue isn't becoming cash. The strongest dashboard connects these measures instead of ranking one number above all others.
How often should dental practice KPIs be reviewed?
Review operating metrics weekly when the team can still act on the result. A/R aging, attendance, schedule gaps, and utilization need timely attention. Review financial KPIs monthly, then use rolling-three-month trends to reduce noise. Retention and lifetime value need a longer window because patient behavior develops over time. Every metric should have an owner and a defined action threshold.
What systems supply dental practice KPI data?
The practice management system supplies production, appointments, provider activity, treatment, and patient balances. Payroll supplies labor cost. Claims and payer systems supply reimbursement status. Sage Intacct supplies the controlled ledger, cash reporting, payables, reconciliations, and multi-entity financial statements. The systems must share consistent provider, location, payer, and account dimensions.
How should a multi-location dental group compare sites?
Use standardized definitions and explain variance. Compare production, collections, overhead, utilization, retention, access, and quality together. Don't rank sites on a single monthly number. Geography, payer mix, specialty, provider experience, staffing model, site maturity, and access mission can change the economics. Rolling periods and cohort analysis produce better decisions than an unqualified league table.
Why shouldn't production be treated as cash?
Production records the value of clinical work performed. Collections show what the practice received. Contractual adjustments, write-offs, claim delays, and patient balances can create a gap between the two. Finance leaders should report both and reconcile them. A high production figure with aging receivables can conceal a cash problem rather than prove financial strength.
What should a CFO do before buying ERP software?
Define the KPI formulas, owners, source systems, dimensions, and reconciliation rules first. Decide how provider, location, payer, procedure, and entity data will flow into financial reporting. Then test whether the ERP and implementation partner can support that design. A short working session can expose whether the organization needs software alone or a partner-led data and reporting implementation.
Lucentive helps dental practices and DSOs connect practice management, payables, receivables, cash flow, and multi-site reporting through Sage Intacct implementation and financial reporting services. Visit Lucentive to schedule a 30-minute working session and test which KPIs fit your reporting needs.